

Most support teams are sitting on a goldmine of data they never fully use. Every conversation, response time, escalation, and resolution contains signals that could improve your operation — but without the right tools, that data lives in a spreadsheet nobody reads, or worse, disappears entirely.
AI-driven support analytics and performance monitoring changes this. Instead of manually compiling weekly reports or guessing which metrics actually move the needle, AI surfaces the insights that matter, in real time, across every channel your team operates on.
This guide covers what AI-driven support analytics is, which metrics to prioritise, how to implement performance monitoring without overhauling your entire tech stack, and how chatloop.io brings it all together in one place.
What Is AI-driven Support Analytics and Performance Monitoring?
AI-driven support analytics refers to the use of artificial intelligence and machine learning to collect, process, and interpret data from customer support interactions. Unlike traditional reporting — which shows you what happened after the fact — AI-powered analytics identifies patterns as they emerge and helps you act on them in real time.
Performance monitoring support takes this a step further by continuously measuring how your team, your automated agents, and your overall support operation are performing against defined targets.
Together, these two capabilities give support leaders a complete, always-on view of their operation — from individual agent quality to automation effectiveness to customer satisfaction trends across the week.
The Difference Between Traditional Reporting and AI Analytics
| Capability | Traditional Reporting | AI-driven Analytics |
|---|---|---|
| Data frequency | Weekly or monthly exports | Real-time, continuous |
| Pattern detection | Manual review required | Automatic anomaly alerts |
| Sentiment tracking | Not available | Built-in across all channels |
| Predictive insights | None | Volume forecasting, churn signals |
| Agent coaching | Manager-led, ad hoc | AI-flagged conversation reviews |
| Effort required | High (manual compilation) | Low (automated dashboards) |
Why AI Support Metrics Matter More Than Raw Numbers
There is a temptation to measure everything — ticket volume, response time, resolution rate, CSAT, NPS, handle time, escalation rate, and more. The problem is that raw numbers without context can be misleading. A low ticket volume might mean your customers are happy, or it might mean they have stopped bothering to reach out.
AI support metrics solve this by adding context automatically. Rather than telling you that response times increased by 12% last week, AI-driven support analytics will tell you that response times increased on a specific channel, during a specific time window, for a specific category of query — and suggest whether the cause was staffing, a product issue, or an uptick in a recurring question that could be automated.
That level of granularity is what turns data into decisions.
The Core Metrics Every Support Team Should Track
Not all metrics are created equal. Here are the ones that genuinely reflect the health of your support operation and are best tracked through AI-driven tools.
1. Automation Rate
The percentage of conversations fully resolved by your AI agent without human involvement. This is the headline metric for any team using chatloop.io or a similar platform.
Target range: 40–65% for most small to mid-size businesses
What it tells you: Whether your knowledge base is complete and your AI agent is well-trained
Warning sign: Below 30% after the first 60 days usually indicates knowledge base gaps
2. First Response Time (FRT)
How long a customer waits from sending their first message to receiving a reply — whether from AI or a human agent.
Target range: Under 10 seconds for AI-handled conversations; under 3 minutes for human-handled
What it tells you: Whether your availability matches customer expectations
Warning sign: FRT rising on a specific channel often signals a routing or staffing issue
3. Resolution Time
The total time from a customer's first message to the conversation being marked resolved.
Target range: Under 5 minutes for automated flows; under 24 hours for complex human-handled queries
What it tells you: Efficiency of your end-to-end support process
Warning sign: Long resolution times on simple queries suggest escalation rules need tightening
4. Customer Satisfaction Score (CSAT)
A post-conversation survey score, typically collected automatically after each resolved interaction.
Target range: 85%+ for AI-handled conversations; 80%+ for human-handled
What it tells you: Whether resolution quality matches speed
Warning sign: High automation rate paired with declining CSAT means the AI is resolving conversations customers are not actually satisfied with
5. Escalation Rate
The percentage of AI-handled conversations that are transferred to a human agent.
Target range: 10–25% is healthy; above 35% suggests the AI is under-trained
What it tells you: Where your automation has gaps
Warning sign: A sudden spike in escalation rate often tracks to a product change, a new query type, or an outage
6. Containment Rate
Similar to automation rate but specifically measures whether the customer completed their goal without needing a human — even if they technically touched both AI and human stages.
Target range: 70–80% for mature deployments
What it tells you: End-to-end effectiveness of your automated support flows
7. Conversation-to-Lead Conversion Rate
For teams using support as a sales channel, this tracks how many inbound conversations result in a qualified lead or completed purchase.
Target range: 5–15% depending on industry and intent
What it tells you: How effectively your support operation contributes to revenue
How AI-driven Analytics Works Inside chatloop.io
chatloop.io uses conversational AI to do more than just respond to customers — it continuously analyses every interaction to surface operational insights your team can act on.
Signal Detection Across Every Conversation
Every message your customers send contains signals: intent, urgency, sentiment, topic, and outcome. chatloop.io's AI layer processes these signals automatically, categorising conversations by type and flagging patterns that deviate from the norm.
For example, if a cluster of customers in a single day are asking about a specific product feature, the system will surface that as a spike in a particular topic — giving you early warning of a product issue, a content gap, or an emerging FAQ that should be automated.
Automated Conversation Scoring
Rather than waiting for a customer to submit a CSAT survey (which most do not), chatloop.io scores conversations automatically based on resolution quality, response accuracy, sentiment trajectory, and whether the customer returned within 24 hours with the same query.
This gives you a reliable quality signal even for conversations where the customer did not leave a rating.
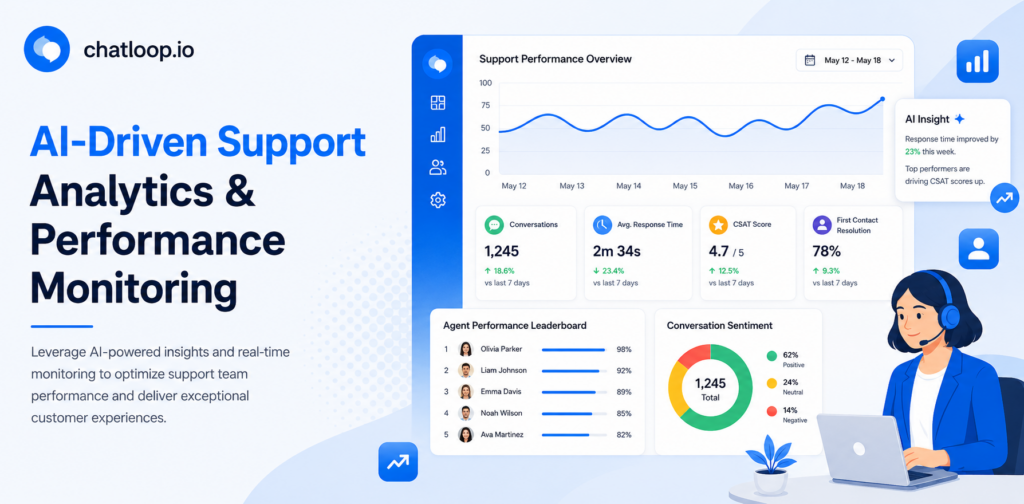
Real-time Performance Dashboards
Your performance monitoring support dashboard in chatloop.io updates in real time. You can view:
- Live conversation volume by channel
- Automation rate over the past hour, day, or week
- Escalation triggers and their frequency
- Agent workload distribution
- Topic trends and emerging query categories
- CSAT scores by channel, agent, and conversation type
Implementing AI-driven Performance Monitoring: A Practical Framework
Setting up AI-driven support analytics does not require a data team or a six-month implementation. Here is a straightforward framework for getting meaningful insights live within a few weeks.
Step 1 — Define Your Baseline (Week 1)
Before you can measure improvement, you need to know where you are starting. Pull your current numbers for:
- Average daily conversation volume
- Current first response time by channel
- Existing CSAT score (if you have one)
- Estimated percentage of queries being handled manually vs. automated
If you do not have clean data here, a rough estimate is fine. The point is to establish a reference point so improvements are visible.
Step 2 — Identify Your Priority Metrics (Week 1)
Do not try to track everything at once. Pick three to five metrics that map directly to your current business goals:
- If your goal is efficiency, prioritise automation rate, resolution time, and escalation rate
- If your goal is customer experience, prioritise CSAT, FRT, and containment rate
- If your goal is revenue, prioritise conversation-to-lead conversion rate and response time on high-intent conversations
Step 3 — Connect Your Channels (Week 2)
AI-driven support analytics is only as complete as the data flowing into it. Connect all the channels your customers use — WhatsApp, live chat, email, and any social messaging — so your performance dashboard reflects the full picture, not just one slice of it.
chatloop.io's omnichannel setup handles this natively, pulling conversation data from every connected channel into a single analytics view.
Step 4 — Set Alerts and Thresholds (Week 2)
Configure automatic alerts for the conditions that require immediate attention:
- Escalation rate exceeds 30% in a rolling hour
- First response time on any channel exceeds 5 minutes
- CSAT drops below 75% for three consecutive days
- A new topic category crosses 20 conversations in a single day
Alerts mean you are not manually checking dashboards — the system tells you when something needs attention.
Step 5 — Run Weekly Reviews (Ongoing)
Establish a weekly 30-minute review cadence using your AI analytics dashboard. The agenda should be consistent:
- Review the previous week's performance against your priority metrics
- Identify the top three conversation categories that escalated to a human
- Check whether any new FAQ patterns have emerged that should be automated
- Update your knowledge base with any gaps identified
- Review any agent-specific quality flags surfaced by the AI
This weekly loop is what turns analytics from a reporting exercise into a continuous improvement engine.
Using Analytics to Improve AI Agent Quality Over Time
One of the most powerful applications of AI-driven support analytics is using the data to make your AI agent smarter over time. This is not automatic — it requires a deliberate improvement loop — but the data to run that loop is already being collected.
Identify Resolution Failures
Your analytics dashboard will show you conversations where the AI attempted to resolve a query but the customer escalated, repeated their question, or gave a low CSAT score. These are your highest-priority training opportunities.
For each failure category, the fix is usually one of three things:
- Missing knowledge: The AI did not have the answer — add it to the knowledge base
- Wrong intent classification: The AI misread what the customer wanted — refine the intent model
- Poor response quality: The answer existed but was phrased badly — rewrite the response template
Spot Emerging Query Types Early
Customers do not always ask questions in the way your knowledge base anticipates. AI-driven analytics will cluster similar queries together even when the phrasing varies, showing you patterns your keyword-based tools would miss.
If ten customers in a week asked variations of "how do I change my billing date" but your knowledge base only contains "how do I update my payment method," your analytics will surface that gap before it becomes a high-escalation category.
Measure the Impact of Every Knowledge Base Update
Every time you add or update content in your knowledge base, your analytics dashboard will show whether automation rate improved on that query type in the following week. This creates a direct feedback loop between your content team and your support performance data — a loop that compounds over time.
Common Mistakes in Support Performance Monitoring
Tracking Too Many Metrics at Once
When everything is a priority, nothing is. Start with three to five metrics and add more only once you have established a consistent review cadence.
Optimising for Speed at the Expense of Quality
First response time is important, but not at the cost of accuracy. An AI agent that responds instantly with the wrong answer will drive CSAT down faster than a slow one. Always pair speed metrics with quality metrics.
Ignoring the Escalation Data
Escalation reports are the most actionable dataset in your entire analytics stack. Every escalation is a direct signal that your automation has a gap. Teams that review escalation data weekly consistently outperform those that do not.
Measuring AI and Human Performance with the Same Benchmarks
AI agents and human agents have different strengths. AI agents should be benchmarked on automation rate, containment, and FRT. Human agents should be benchmarked on resolution quality, CSAT on complex queries, and handle time on escalated conversations. Mixing these benchmarks produces misleading results.
The Business Case: What Good Analytics Unlocks
Teams that implement structured AI-driven support analytics and performance monitoring typically see:
- 25–40% reduction in support costs within six months, driven by higher automation rates informed by analytics data
- 15–30% improvement in CSAT from faster identification and resolution of recurring issues
- 50% reduction in time spent on manual reporting, freeing support managers for coaching and strategy
- Earlier detection of product issues, with analytics surfacing customer complaint clusters before they escalate to social media or churn
The compounding effect is significant. Each weekly review cycle improves automation quality, which reduces escalation volume, which frees agent time, which allows for more thorough quality work — and the cycle repeats.
Frequently Asked Questions
What is the difference between support analytics and customer support reporting?
Traditional customer support reporting gives you a static view of historical data — typically a weekly or monthly export of ticket volumes, response times, and satisfaction scores. AI-driven support analytics provides a continuous, real-time view with pattern detection, anomaly alerts, sentiment tracking, and predictive signals that static reports cannot surface.
How quickly can I set up performance monitoring support with chatloop.io?
Most teams have their core analytics dashboard live within one to two weeks of connecting their channels. The setup process involves linking your communication channels, defining your priority metrics, and configuring alert thresholds — none of which requires technical development.
Do I need a large support team to benefit from AI support metrics?
No. Even a single-person support operation benefits from automation rate tracking, CSAT monitoring, and topic trend analysis. The insights are valuable regardless of team size, and the time savings from automated reporting are proportionally larger for smaller teams.
Can AI analytics track the performance of human agents as well as AI agents?
Yes. chatloop.io's performance monitoring covers both automated and human-handled conversations, giving you a unified view of quality across your entire support operation. Human agent metrics include resolution time, CSAT on escalated conversations, and re-open rate.
How does sentiment analysis work in support analytics?
AI-driven sentiment analysis reads the tone and language of each customer message throughout a conversation — not just at the end. It detects when a conversation is trending negative before the customer explicitly complains, allowing for proactive escalation or agent intervention before satisfaction is lost.
Conclusion
AI-driven support analytics and performance monitoring is what separates support teams that react to problems from those that prevent them. By tracking the right metrics in real time, using AI to surface patterns that manual reporting misses, and building a consistent weekly improvement loop, any support operation — regardless of size — can become measurably more efficient and more customer-focused over time.
The data is already there in every conversation your team handles. The question is whether you have the tools to read it.
chatloop.io gives you those tools out of the box — connecting your channels, surfacing your metrics, and turning every conversation into a data point that makes the next one better.
Your Next Steps
- Audit your current metrics — identify what you are tracking today and what is missing
- Define your three priority metrics — align them to your current business goal (efficiency, experience, or revenue)
- Connect all your support channels — ensure your analytics covers the full picture
- Set up automated alerts — so you are notified when performance deviates from your targets
- Book a demo with chatloop.io — see the analytics dashboard live with your own use case

6 Responses on this post
Comments are closed.