

Traditional customer support is reactive. A customer experiences a problem, contacts support, and your team responds. But what if you could anticipate problems before customers even notice them?
Predictive analytics in customer support uses historical data and machine learning to identify patterns that indicate future problems. By acting on these predictions, support teams can prevent issues, reduce churn, and transform support from a cost center into a profit center.
This guide explores how forward-thinking companies are implementing predictive analytics to stay ahead of customer needs and dramatically improve business outcomes.
The Cost of Reactive Support
Current Model
Most companies operate on a reactive support model: customer experiences issue → contacts support → support team responds → issue resolved (hopefully). This creates multiple costs:
Operational Cost: Reactive support requires more agents (always dealing with backlog). Average cost per ticket: $3-7.
Customer Experience Cost: Long wait times frustrate customers. Each hour of wait time increases churn likelihood by 5-8%.
Preventable Churn: 30-40% of churn results from issues that support teams could have prevented with better timing.
Revenue Lost: Churned customers don't just leave; they often tell others. For every one customer that leaves, you lose 5-10 in reputation damage.
The Financial Impact
For a SaaS company with 10,000 customers, $100 average monthly revenue per customer, and 5% annual churn rate:
- Annual revenue lost to churn: $60,000,000 (5% × 10,000 customers × $100 × 12 months)
- If predictive analytics prevents just 20% of preventable churn: $12,000,000 recovered
- System cost: $50,000/year
- ROI: 240x
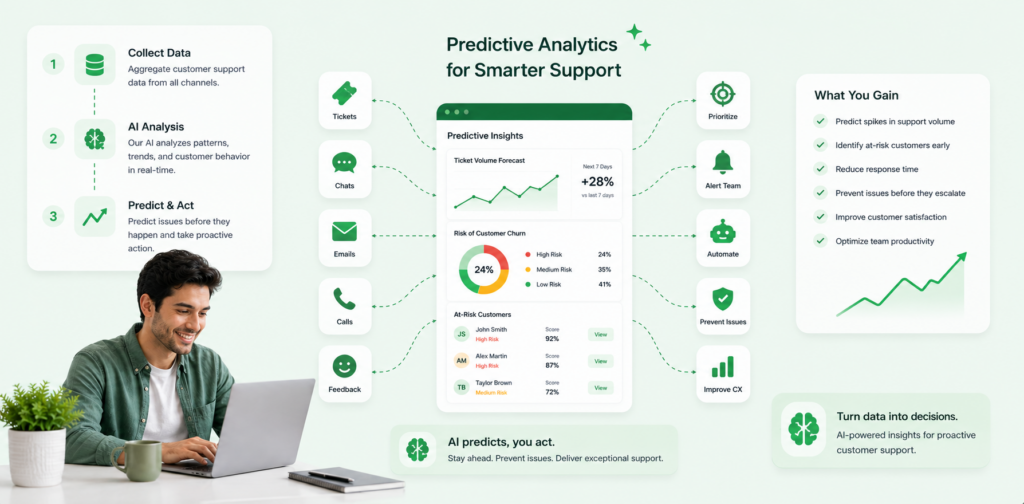
How Predictive Analytics Works
Data Collection
The system ingests data from multiple sources: customer usage patterns (how often they log in, which features they use), support ticket history (what issues they had before), engagement metrics (email opens, tutorial completions), product health indicators (performance degradation, errors), and account characteristics (company size, product tier, tenure).
Pattern Recognition
Machine learning algorithms identify patterns that precede problems. For example: customers who haven't logged in for 7 days but then do heavy usage are likely experiencing a forgotten password issue. Customers increasing usage of support documentation might be struggling with features. Customers reporting multiple similar issues might hit a critical bug soon.
Prediction Scoring
The system scores each customer based on risk factors. Low risk (score 70): Proactive intervention needed.
Automated Actions
Based on prediction scores, the system triggers automated interventions: proactive outreach, resource allocation, targeted education, or urgent escalation.
Practical Applications
1. Churn Prediction
Identify customers likely to cancel in the next 30 days. Early indicators include: declining usage, support tickets about pricing, feature requests not being fulfilled, complaints about competitors.
Intervention: Reach out before they cancel. Offer solutions, discounts, or feature roadmap clarity. Typical prevention rate: 30-40% of predicted churners.
2. Issue Prediction
Identify customers likely to experience problems based on their usage patterns and known issues.
Example: Your product has a known issue with large file uploads when using Safari on macOS. Predictive analytics identifies: Safari users + file upload feature users + recent usage increase. System triggers: proactive email with workaround before they hit the issue.
3. Satisfaction Prediction
Identify customers likely to have low satisfaction based on support ticket sentiment and resolution patterns.
Intervention: Assign to experienced agent, offer additional support, or manager follow-up to ensure satisfaction.
4. Upsell Prediction
Identify customers ready for upsell based on usage patterns exceeding their current plan.
Intervention: Personalized upsell offer at right time with right feature highlights.
Implementation Strategy
Phase 1: Data Foundation (Weeks 1-2)
Gather historical data (minimum 12 months). Clean and organize data. Identify key metrics that correlate with problems or churn. Build customer profiles based on history.
Phase 2: Model Development (Weeks 3-4)
Select or build predictive model. Train on historical data. Test on holdout dataset. Achieve target accuracy (typically 80%+). Validation: Does model correctly predict 80% of customers who actually churned in historical data?
Phase 3: Integration (Week 5)
Integrate model with support systems. Set up automated trigger actions. Configure dashboards for team visibility. Test end-to-end workflows.
Phase 4: Soft Launch (Week 6)
Launch with 25% of customer base. Monitor predictions vs. actual outcomes. Refine model based on results. Gather team feedback.
Phase 5: Scale & Optimize (Weeks 7+)
Full rollout to all customers. Continuous model retraining (monthly). Regular accuracy reviews. Expand to new prediction types.
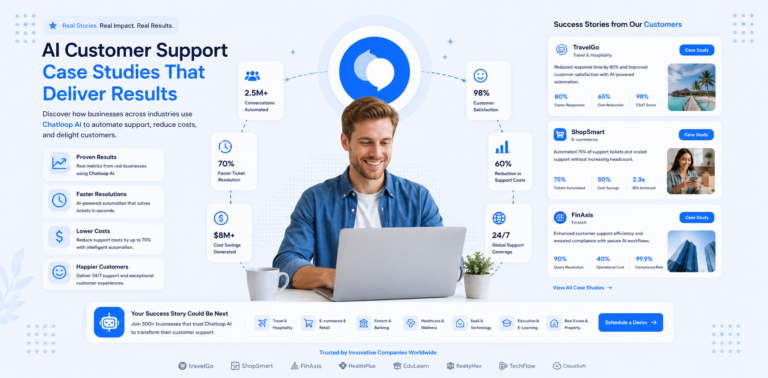
Real-World Results
Case Study 1: SaaS with 5,000 customers
Before Predictive Analytics: 8% annual churn rate = 400 customers, $4.8M revenue loss.
Predictions: Model identifies 250 at-risk customers (60 days to churn).
Interventions: Personalized outreach, feature education, pricing assistance.
Results:
- 40% of predicted churners retained (100 customers)
- Churn rate: 8% → 6.4%
- Revenue saved: $1.2M annually
- System cost: $35,000
- ROI: 34x
Case Study 2: E-Commerce with 50,000 customers
Before: 25% annual churn on repeat purchase rate.
Implementation: Predict which customers won't reorder based on usage, satisfaction, browsing patterns.
Results:
- Predicted non-repurchase customers: 8,500
- Intervention success rate: 35%
- Additional repeat purchases: 2,975
- Revenue impact: $447,000 (assuming $150 average order value)
Best Practices
1. Start Simple
Don't try to predict everything at once. Start with churn prediction—highest ROI and easiest to measure. Add other predictions after you prove value.
2. Focus on Actionable Predictions
Predictions are only valuable if they enable action. "This customer will churn" is valuable (you can intervene). "This customer is using the product" is not actionable.
3. Complement with Human Judgment
Predictions are guidance, not law. An experienced support professional recognizes nuance that models miss. Use predictions to augment human decision-making, not replace it.
4. Continuous Retraining
Customer behavior changes. Market conditions change. Retrain your model monthly with new data. Annual retraining ensures model stays accurate.
5. Measure and Validate
Constantly compare predictions to actual outcomes. If you predicted 100 customers would churn and 60 actually did, model is 60% accurate. Work to improve accuracy over time.
Metrics to Track
| Metric | Target | Impact |
|---|---|---|
| Prediction Accuracy | 80%+ | Trust in system |
| Churn Prevention Rate | 30%+ | Direct ROI |
| Average Intervention Cost | <$50 | Economics work |
| Time to Act | <24 hours | Prevent escalation |
| Customer Satisfaction | +5-10 points | Proactive help appreciated |
Common Challenges
Challenge: Predictions have too many false positives. Solution: Increase prediction threshold. Only flag high-confidence predictions initially.
Challenge: Team doesn't trust the model. Solution: Show historical accuracy. Share examples where model correctly predicted outcomes.
Challenge: Can't act fast enough on predictions. Solution: Automate common interventions (email outreach, resource assignment).
Challenge: Data quality is poor. Solution: Invest in data cleaning and standardization first.
Advanced Applications
Sentiment Prediction
Predict sentiment of support tickets before they're resolved. Flag likely negative experiences for manager review.
Feature Adoption Prediction
Predict which customers will adopt new features based on their profile and usage patterns. Target marketing and education efforts accordingly.
Lifetime Value Prediction
Predict customer lifetime value based on early behavior patterns. Allocate support resources accordingly (high-value customers get premium support).
Conclusion
Predictive analytics transforms support from reactive firefighting to proactive relationship management. By identifying problems before they happen and customers before they churn, companies can dramatically improve retention, satisfaction, and profitability.
Most organizations implementing predictive analytics see 20-40% reduction in churn and 30-50% improvement in customer satisfaction within 6 months.
The competitive advantage belongs to companies that can anticipate customer needs. Predictive analytics makes that possible.
Next Steps
- Audit your historical data - what do you have?
- Identify your churn indicators - what predicts leaving?
- Calculate churn cost - what's prevention worth?
- Request platform demos - how do they handle predictions?
- Plan pilot - start with churn prediction
Ready to stop firefighting and start predicting? Most analytics platforms offer historical analysis to show you what could have been prevented.


5 Responses on this post
Comments are closed.